免費
guide
Rankings that change over time make some of the most watched data videos. How to turn a small table into a bar chart race, free, with the Bar Chart Race block.
2026年11月3日 · 閱讀約 1 分鐘
這篇指南暫未提供你的語言版本,因此以英文顯示。
A bar chart race turns a dull table into a contest: who leads, who climbs, who gets overtaken. It works for sales by product, users by country, scores by team, anything ranked over time.
| Habit | Why it works |
|---|---|
| Four to eight series | Enough for overtakes, few enough to follow |
| Four to eight periods | Each period gets about two seconds on screen |
| One story to watch | Put the accent colour on the item that climbs |
| Clear units | A prefix or suffix like $, k or % beats a note in the subtitle |
| Honest numbers | Viewers screenshot charts; use data you can stand behind |
Bar Chart Race is a free, open-source HyperFrames block. Paste your data as plain text, one line per series, and it animates the bars, the overtakes, the count-up labels and the rescaling axis. Ask your agent:
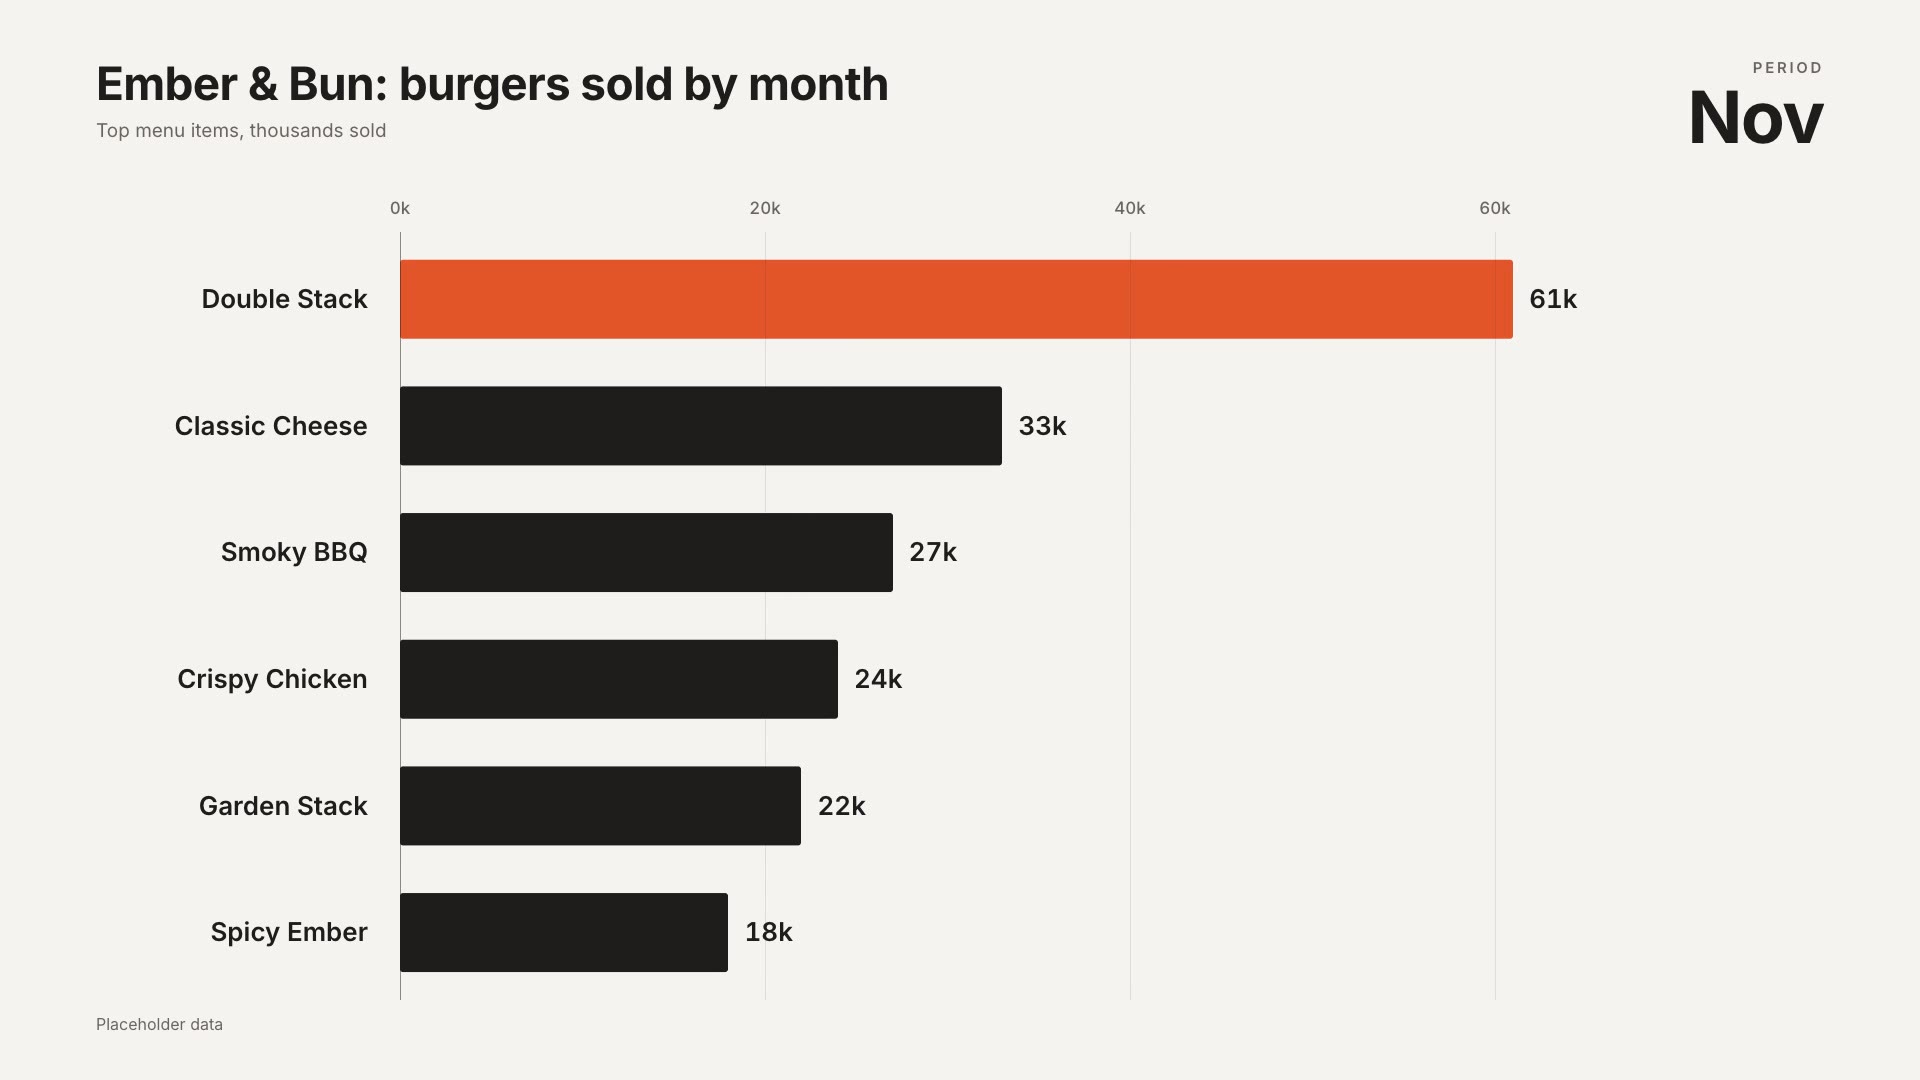
Make a bar chart race titled "Ember & Bun: burgers sold by month", June to November in thousands: Double Stack 12, 18, 26, 35, 47, 61; Classic Cheese 22, 25, 28, 30, 32, 33; plus four more items.Your agent can convert a spreadsheet into the text format for you.
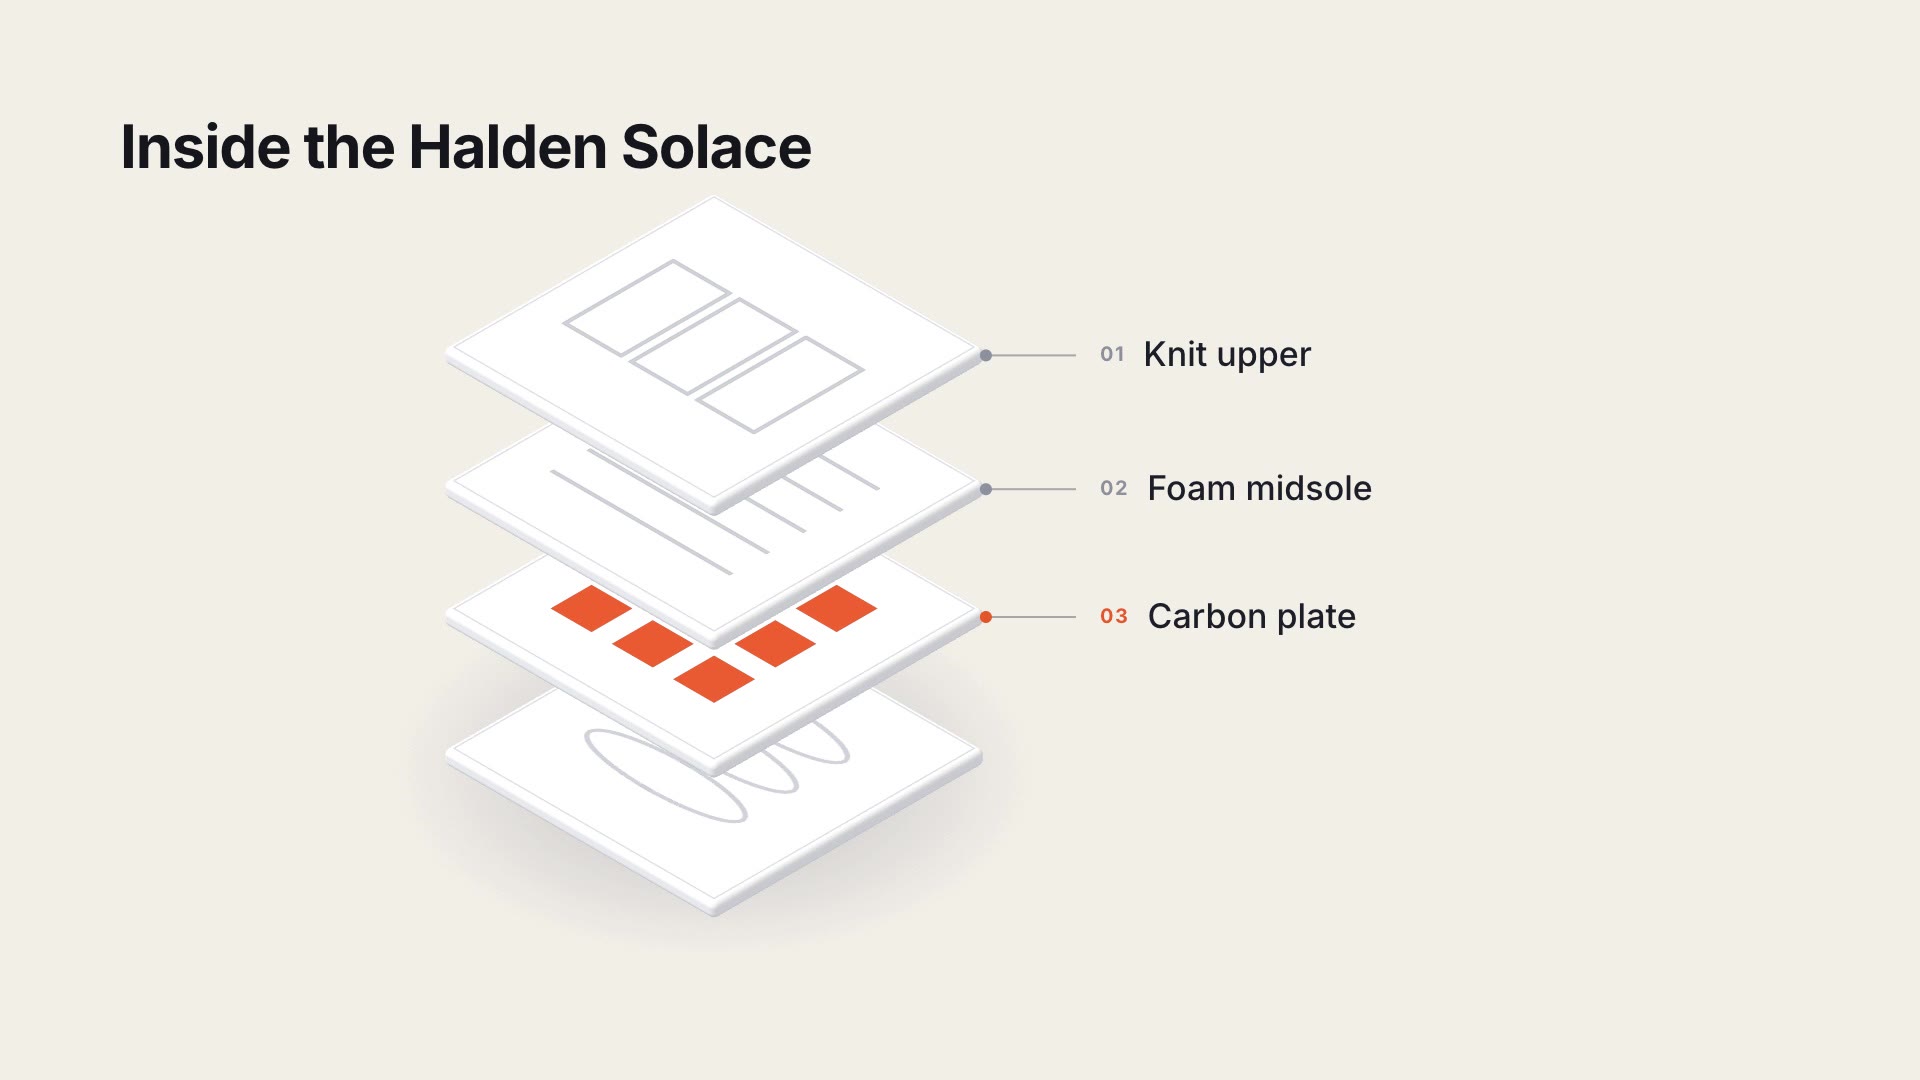
For a single structure explained in layers, try the Exploded Layer Stack.