무료
guide
Two measures moving together tell a story. How to build an editorial bar-and-line chart that animates itself, free, with the Bar and Line Chart block.
2026년 11월 3일 · 1분 분량
이 가이드는 아직 해당 언어로 제공되지 않아 영어로 표시됩니다.
Sales and repeat buyers, traffic and sign-ups, revenue and margin: a bar-and-line chart shows how two measures move together. Animated month by month, it lets viewers see the trend form.
| Habit | Why it works |
|---|---|
| Two related measures | Bars for volume, a line for a rate |
| Separate scales | Keep the line above the bars so labels never overlap |
| Units everywhere | In the subtitle and the legend |
| Serif headline | An editorial look reads as trustworthy |
| A source line | Say where the numbers come from |
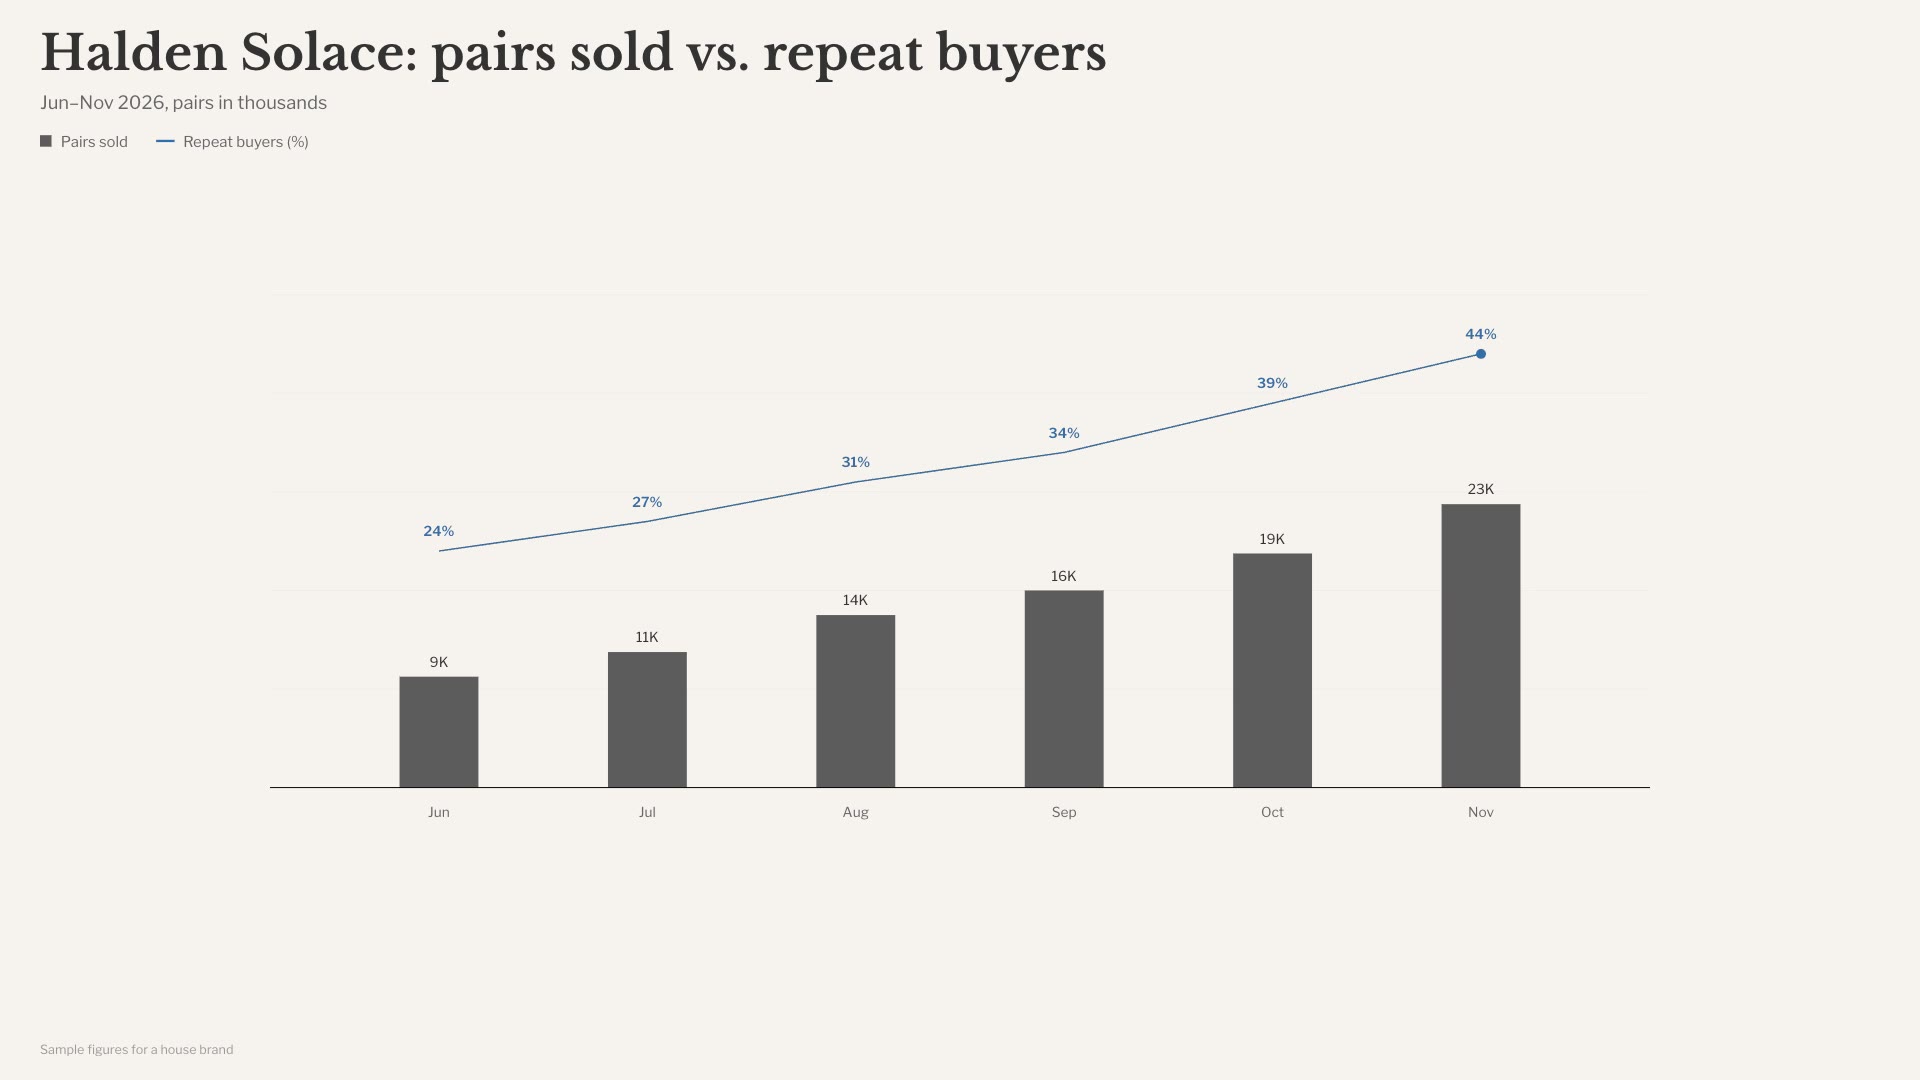
Bar and Line Chart is a free, open-source HyperFrames block. An editorial bar-and-line chart builds month by month: bars rise, a line draws across them and every value counts up. Ask your agent:
Make a bar and line chart: "Halden Solace: pairs sold vs. repeat buyers", June to November.It renders a 15-second chart with a transparent background, ready for a plain paper colour or your footage.
For another take on the same idea, see Bar Chart Race.