Free
Rendered by this Skill
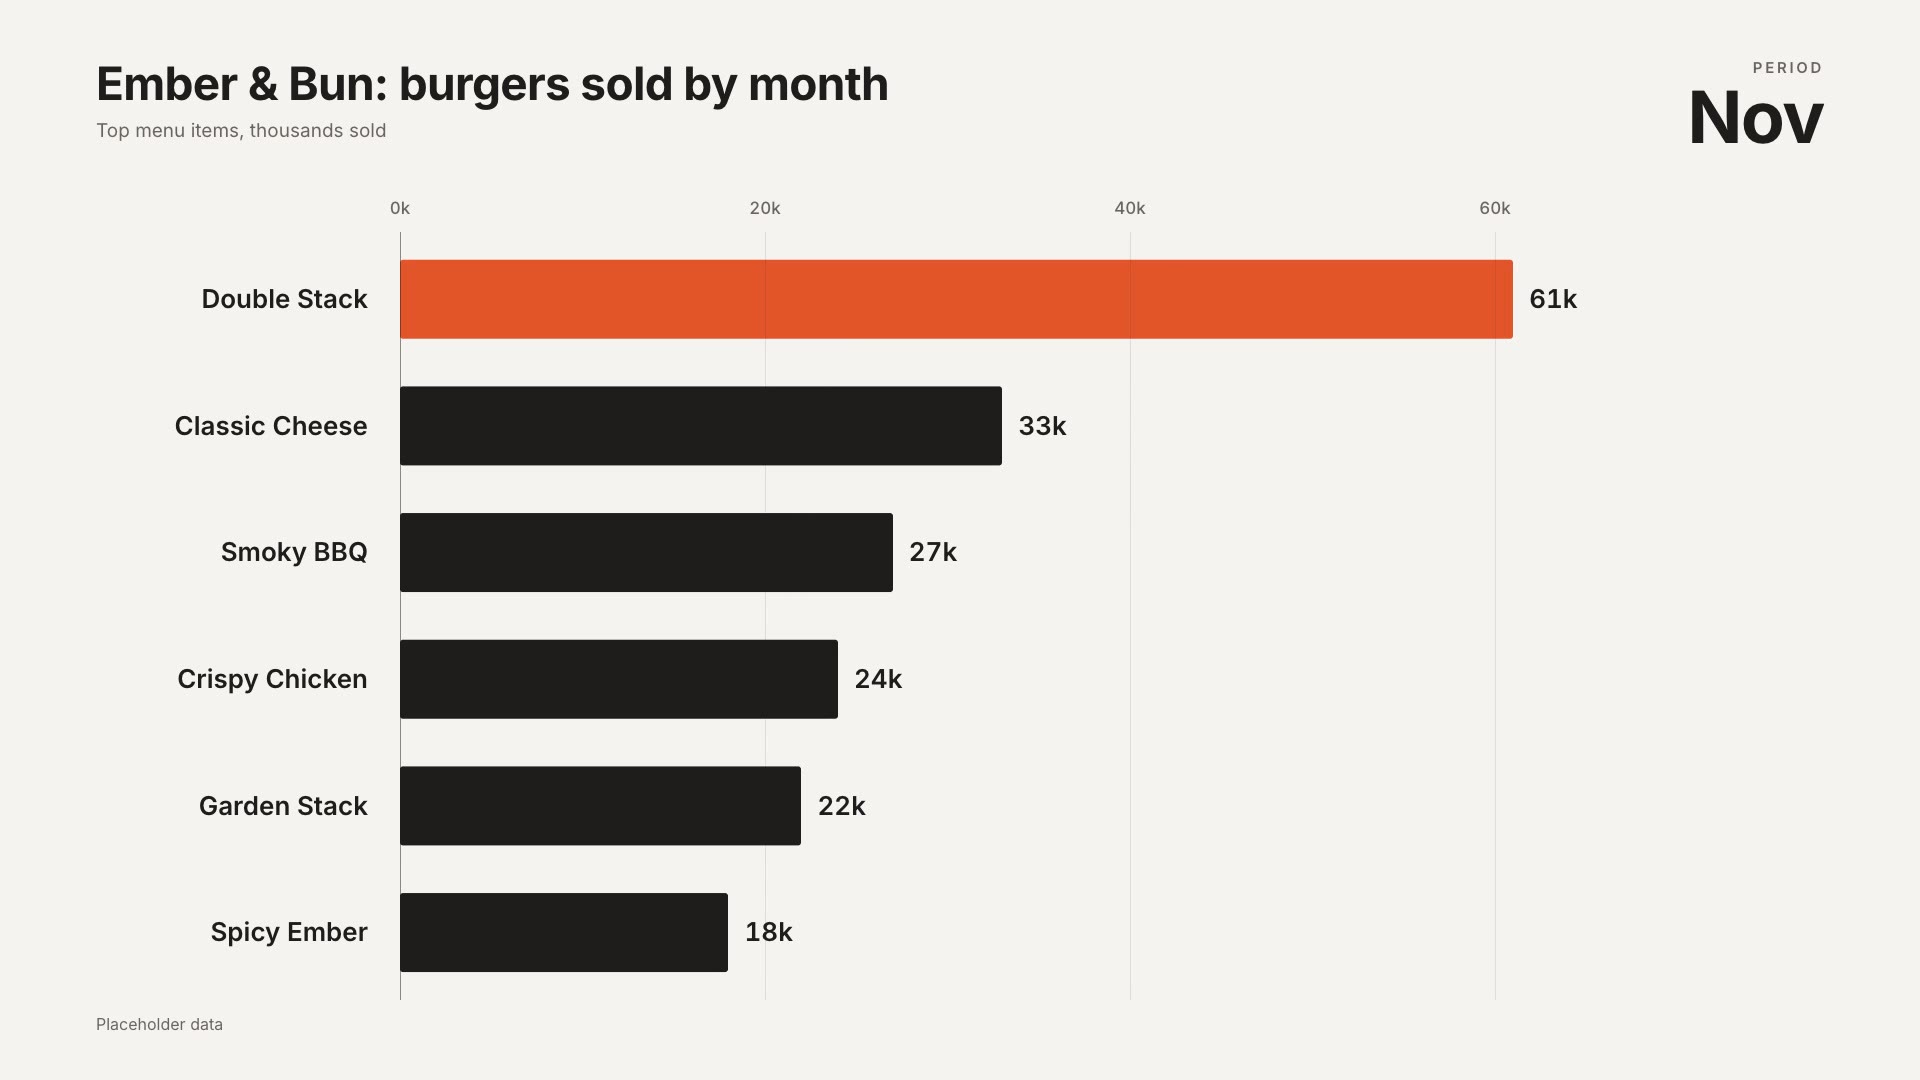
An editorial bar-and-line chart builds month by month: bars rise, a line draws across them and every value counts up.
Free Free with an account
Paste this into your agent. It connects the CLI if needed, then installs the Skill.
A free HyperFrames block for 15 seconds of data storytelling in a newspaper style. Gridlines and month labels appear, bars rise one by one with their values, then a line draws across them with its own percentage labels, under a serif headline, a subtitle, a legend and a source line. Months, both data series, scales, labels and titles are edited in the HTML.
Updated Nov 3, 2026
/data-chart Make a bar and line chart: "Halden Solace: pairs sold vs. repeat buyers", June to November, pairs sold 9 to 23 thousand and repeat buyers 24% to 44%.
Two numbers that move together make a story: sales and repeat buyers, traffic and sign-ups, revenue and margin. Bar and Line Chart shows both in one calm, editorial chart that builds itself, so viewers read the trend before the voice-over explains it.
npx hyperframes render, checks a few frames and renders the final MP4.This is a block from the HyperFrames registry, made by HeyGen and the HyperFrames contributors (heygen-com/hyperframes) and shared under the Apache License 2.0. The download is the block with its assets and a SKILL.md written by Reelity, so your agent knows how to fill and render it; HyperFrames itself runs from npm.
No reviews yet. Install the Skill and be the first to rate it.
Yes. The labels are a list in the script; quarters, years or weeks work.
Set the line's maximum lower than the bars' maximum so the line sits above them; our sample does this.
It is an open-source HyperFrames block by HeyGen and the HyperFrames contributors. We list it as it is, with a SKILL.md so your agent can use it and a sample made with one of our house brands, Halden Solace.